U.S. Aviation Analysis
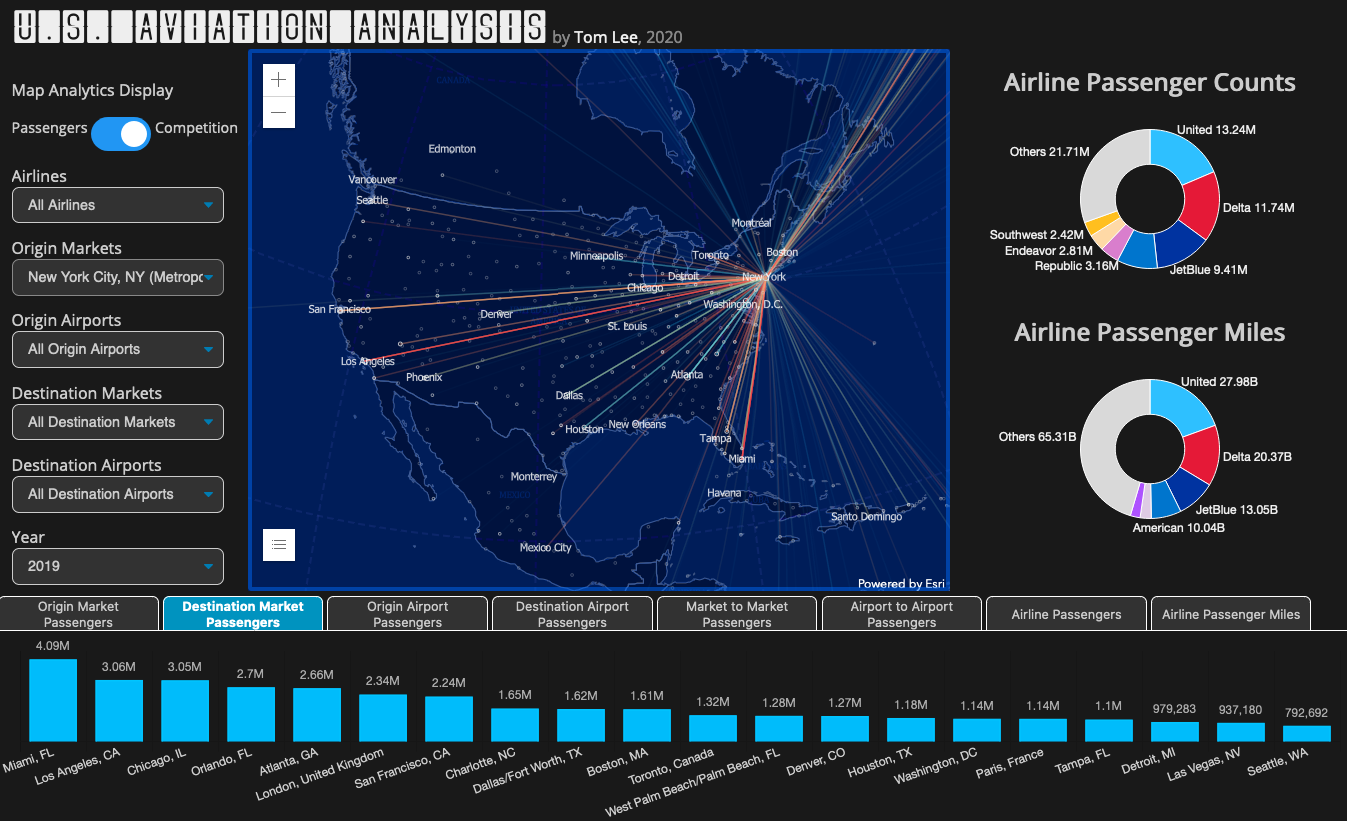
This application aims to investigate market conditions in the U.S. commercial aviation industry, showing the counts of passengers for each airport, market, route, and airline, and also showing the competition between carriers at these levels. Users are able to filter to a specific airport, market, route, airline, or time period. Graphs and charts show summary statistics.
 App showing passenger counts and airline competition on flights originating from New York, NY.
The intended audience is market analysts and aviation planners. Market analysts need to see and understand the size of the market and the competition within the market. Aviation planners need to see how many people travel, where they travel, how many options they have, and how effective are those options are. User testing was conducted at multiple stages throughout the development process, with useful feedback from industry experts guiding UX design and the priority of feature development.
The original data was sourced from the U.S Department of Transportation Aviation Passenger Route Statistics T-100 database. The original dataset contained about 1.4 million records of monthly passenger data for 2017 - 2019. I cleaned and transformed the data in a Postgres database to create a dataset of annual statistics of about 40,000 records.
The app is built using the ArcGIS JavaScript API and Chart JS. The data is hosted as a feature service on ArcGIS Online. The website is hosted on GitHub Pages and the git repository is available on GitHub. Users can access the application on their web browser without needing to install any specialized software.
Full app available at tomtl.github.io/us-aviation. Code available on GitHub at github.com/tomtl/us-aviation. Demo video available on YouTube.