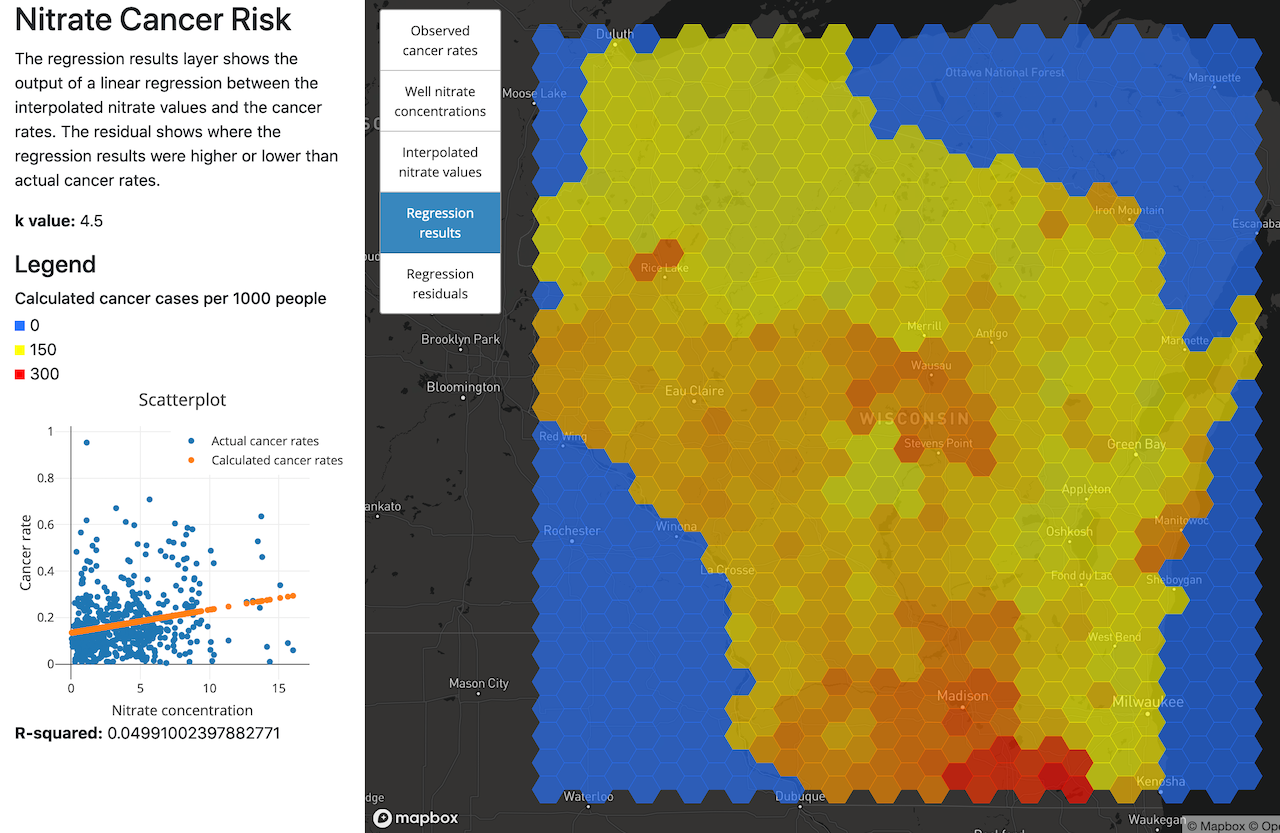
Nitrate Cancer Risk geospatial analysis web app
This application investigates the spatial relationship between well nitrate levels and cancer rates in Wisconsin. Nitrate levels are measured as part of well water quality tests. Cancer occurrences were catalogued over a ten year period.
This application sets out to provide a way for the user to manipulate the distance decay weight k of the nitrate levels data when carrying out a linear regression between well nitrate readings and tract level cancer rates. The interface provides an easy way for users to work with the data, understand the results, and iterate over multiple values of k.
The positive m value of the regression suggests that as nitrate levels increase, so do cancer rates. The comparison of the cancer rates calculated by the regression have a similar spatial distribution to the actual cancer rates, with higher rates in the south. The strength of the relationship between nitrate levels and cancer rates is low with the r-squared level suggesting the nitrate levels are only explaining 5% of the variance in cancer rates.
Full app available here.
